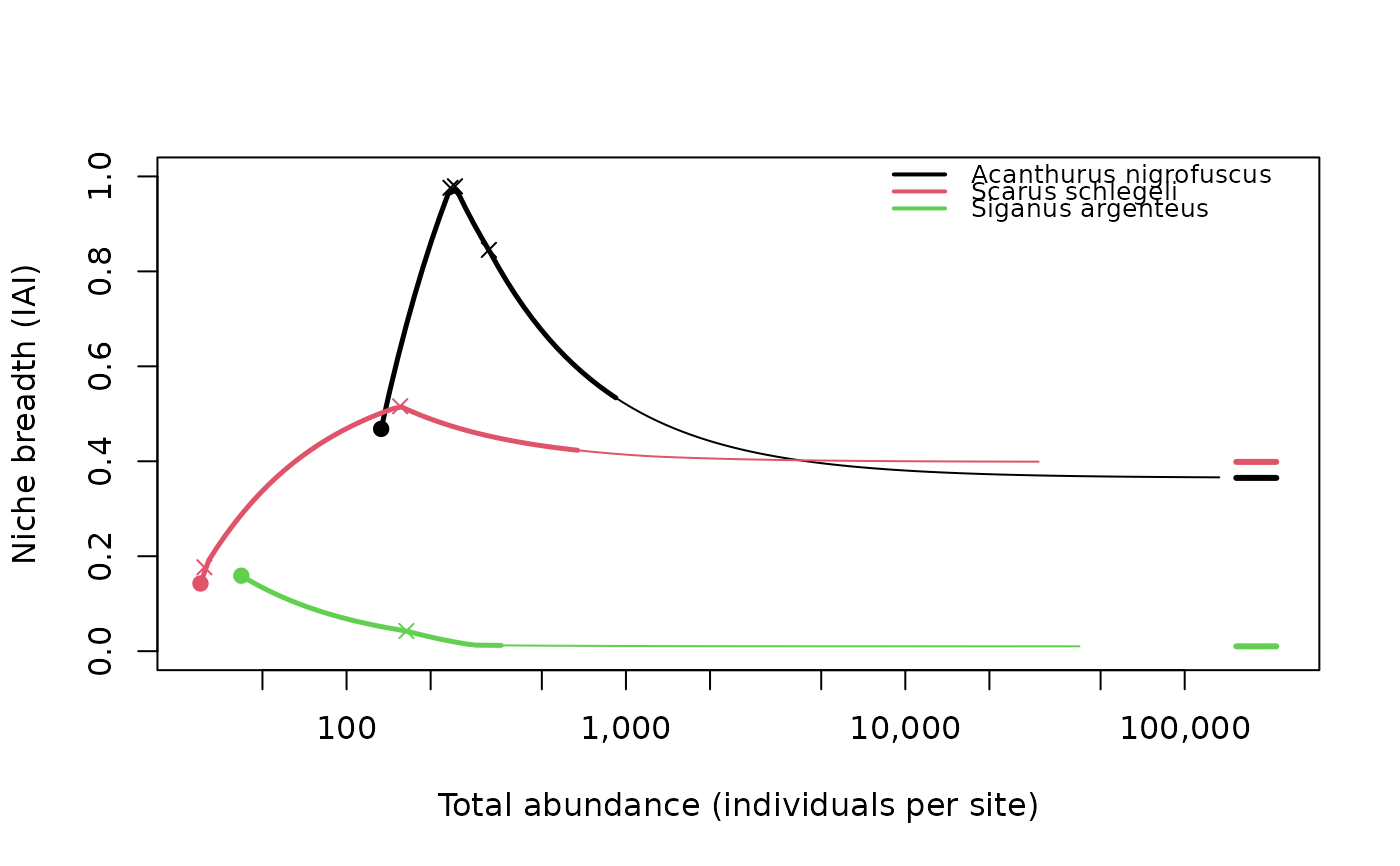
Computes the niche breadth curves of a niche_breadth() result with
iai_curve() and plots them with plot.iai_curve().
Usage
# S3 method for class 'niche_breadth'
plot(x, n_boot = 0, seed = NULL, ...)
Arguments
- x
Output of
niche_breadth().- n_boot, seed
Passed to
iai_curve()(bootstrap bands; default none).- ...
Passed to
plot.iai_curve(), e.g.speciesorx_axis.
Value
The iai_curve() result, invisibly.
Examples
three <- moorea_fish[moorea_fish$species %in% c("Acanthurus nigrofuscus",
  "Scarus schlegeli", "Siganus argenteus"), ]
nb <- niche_breadth(three, species = "species", site = "site",
                    habitat = "habitat", abundance = "abundance",
                    n_boot = 0, diagnostics = list(n_null = 0))
plot(nb)